RudderStack is an open-source platform for collecting and routing your customer event data (commonly known as Customer Data Infrastructure or a CDI platform). Our most recent release introduces a new feature called Live Destination Event Debugger that allows you to debug the events sent to the destination flowing through RudderStack in real-time.
In this document, we dive deeper into the technical aspects of this feature.
Destination Live Events
Routing event data to a destination can fail for various reasons. Often, it could be because of the incorrect configuration of the destination. Some other reasons could be a bad event structure, rate limiting by the destination, and so on. In some rare cases, the destination could be down too. It can be frustrating if the events sent do not show up in the destination and more so, not knowing the reason for failure only makes it worse.
The Destination Live Events feature will give you real-time visibility into the destination's responses. Some key information shown here includes:
- ID of the source from where the event is generated
- Attempt number: RudderStack retries sending a failed job internally. It is retried several times before it is marked as aborted. This retrying happens with some exponential backoff, which helps in sending the event at an acceptable rate. This increases the chance of the success of the job - especially in cases where the destination has some rate limits, or when it is down altogether.
- Job State: This gives the current status of the job. It can be one of the following:
- Succeeded - When the sent event is successfully accepted by the destination
- Failed - When the destination throws an error
- Aborted - When the number of failed attempts reaches a threshold, RudderStack marks the job as aborted
- Waiting - When the current event is waiting for the previous event to be successfully sent (or for that job to be aborted). RudderStack guarantees the order of the events. Hence, if any event fails, the following events are put on hold till the first event is either successfully sent to the destination, or aborted.
- The error code sent by the destination
- The error response sent by the destination
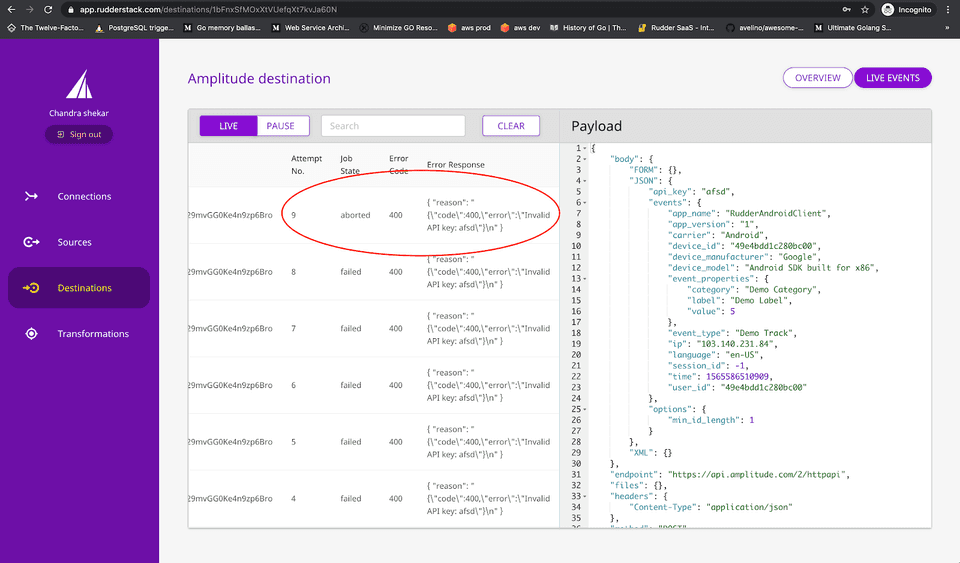
The payload sent to the destination can be seen by clicking on an event. This is shown in the right-hand side box on the same page, as shown in the image below:

As seen above, the Amplitude destination is configured with a wrong API key and the data is ingested through a connected source. When RudderStack tries to send the events to Amplitude, an error is thrown. The error response clearly states that the API key is invalid. This job is tried several times before it is marked as aborted.
The responses received from the destination help in resolving the issues faster.
Viewing Destination Live Events
To view the destination live events, please follow these steps:
- Log in to the RudderStack dashboard
- Click on the destination of your choice in the Connections page
- The Live Events button can be found on the top right of your destination page
- Click on the Live Events button and give your consent to stream the data for viewing purposes
.png)
- Ingest the data into RudderStack through a source connected to this destination. You should be able to see the destination responses in real-time.
Contact Us
If you want to know more about the features of RudderStack, contact us. To know more about the new features in the latest RudderStack release, talk to us in our Slack community.